The city the river made, unmade, and made again
Last revised August 2026. A long-read companion to the live dashboard and facts page. Dashboard - Facts
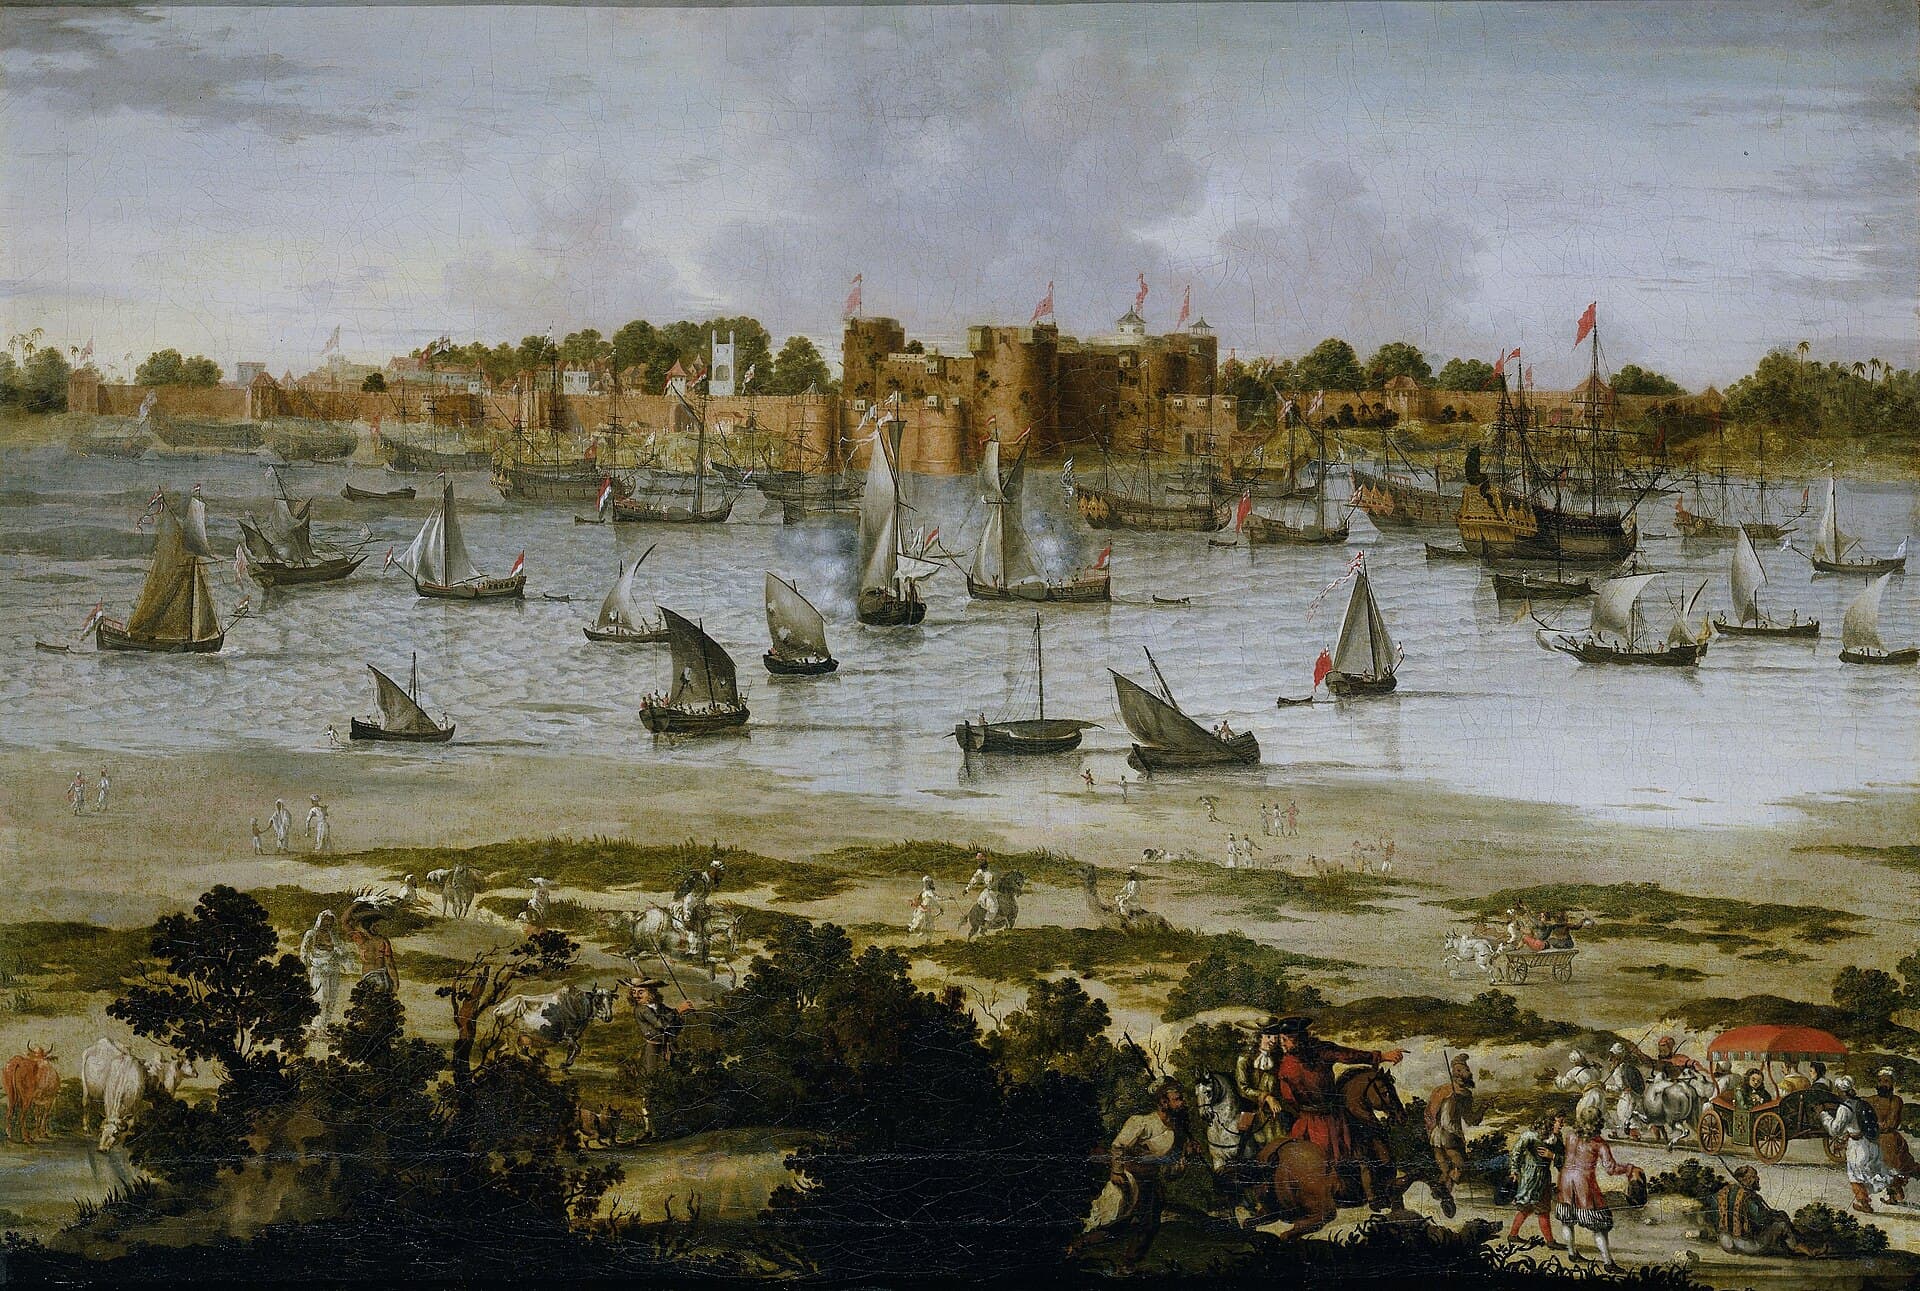
Surat begins with a tank. Around 1516 a man named Gopi dug one on the south bank of the Tapi and called the settlement around it Suryapur; the name shortened, and the city has been Surat ever since. Five hundred years later it is the fastest-growing large city in India, it sells its own sewage back to industry for more than a hundred crore a year, and it publishes the level of every creek running through it against the height at which that creek becomes dangerous. In between, the river that made it the richest port in Mughal India quietly filled its own harbour with silt and handed the trade to Bombay.
Almost every city on this platform is a scarcity story. Surat is not. Surat impounds nothing, stores nothing, and has no meaningful drought anxiety. Its water question has always been the opposite one: not whether the water will come, but how much of it, and how fast.
The port the river made
Surat's greatness was a hydrological accident, and so was its decline.
Surat rose because another harbour failed. Khambhat, up the coast, had been Gujarat's great port until its harbour silted up towards the end of the fifteenth century; the trade moved south to the Tapi mouth, and Surat inherited it. Under Akbar, Jahangir and Shah Jahan it became the chief commercial city of India, with an imperial mint. It was the port from which pilgrims sailed for Mecca. In 1613, after the English broke Portuguese naval supremacy off Swally, the East India Company obtained a firman for a factory here, and the Dutch, French and Portuguese all followed.
Then the river did to Surat exactly what it had done for it. The Tapi silted. By the middle of the nineteenth century larger vessels could not safely reach the city, and the shipping went to Bombay, which had the deeper and more accessible harbour. The Marathas came, and the Company's attention went south with the ships.
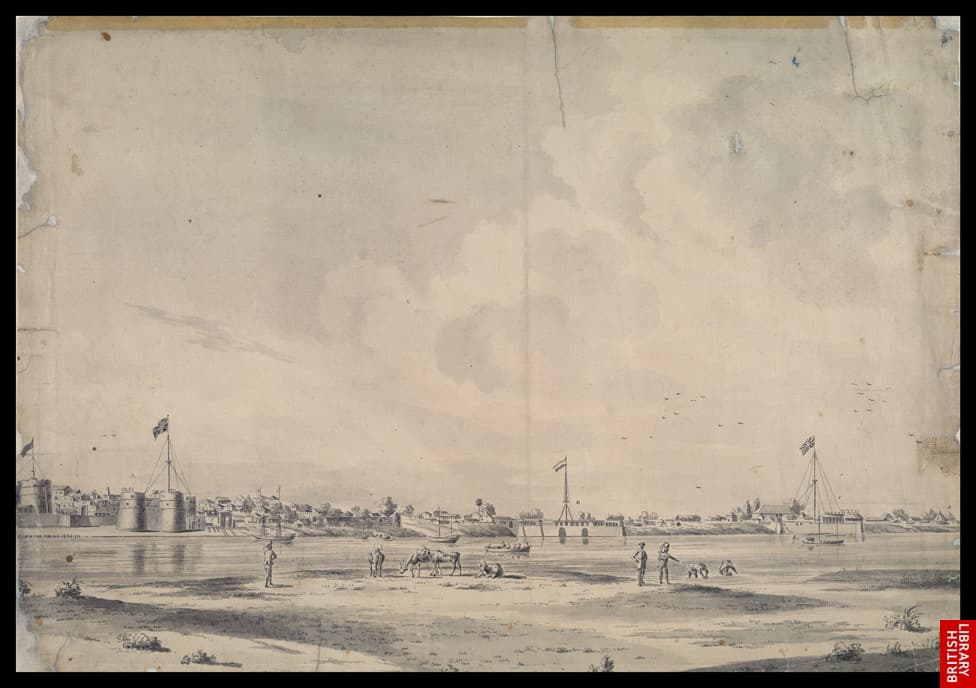
“The same silt that opened Surat's harbour by closing Khambhat's went on to close Surat's.”
It is worth sitting with that, because it sets the pattern for everything that follows. Surat has never controlled the water it depends on. The river gave it a harbour and took the harbour away. Four centuries later the same river gives it drinking water and takes the streets away, and the decision about how much arrives is still made somewhere upstream.
A city named after a water body
Surat's founding infrastructure was a tank, and the city has been building water infrastructure to catch up with itself ever since.
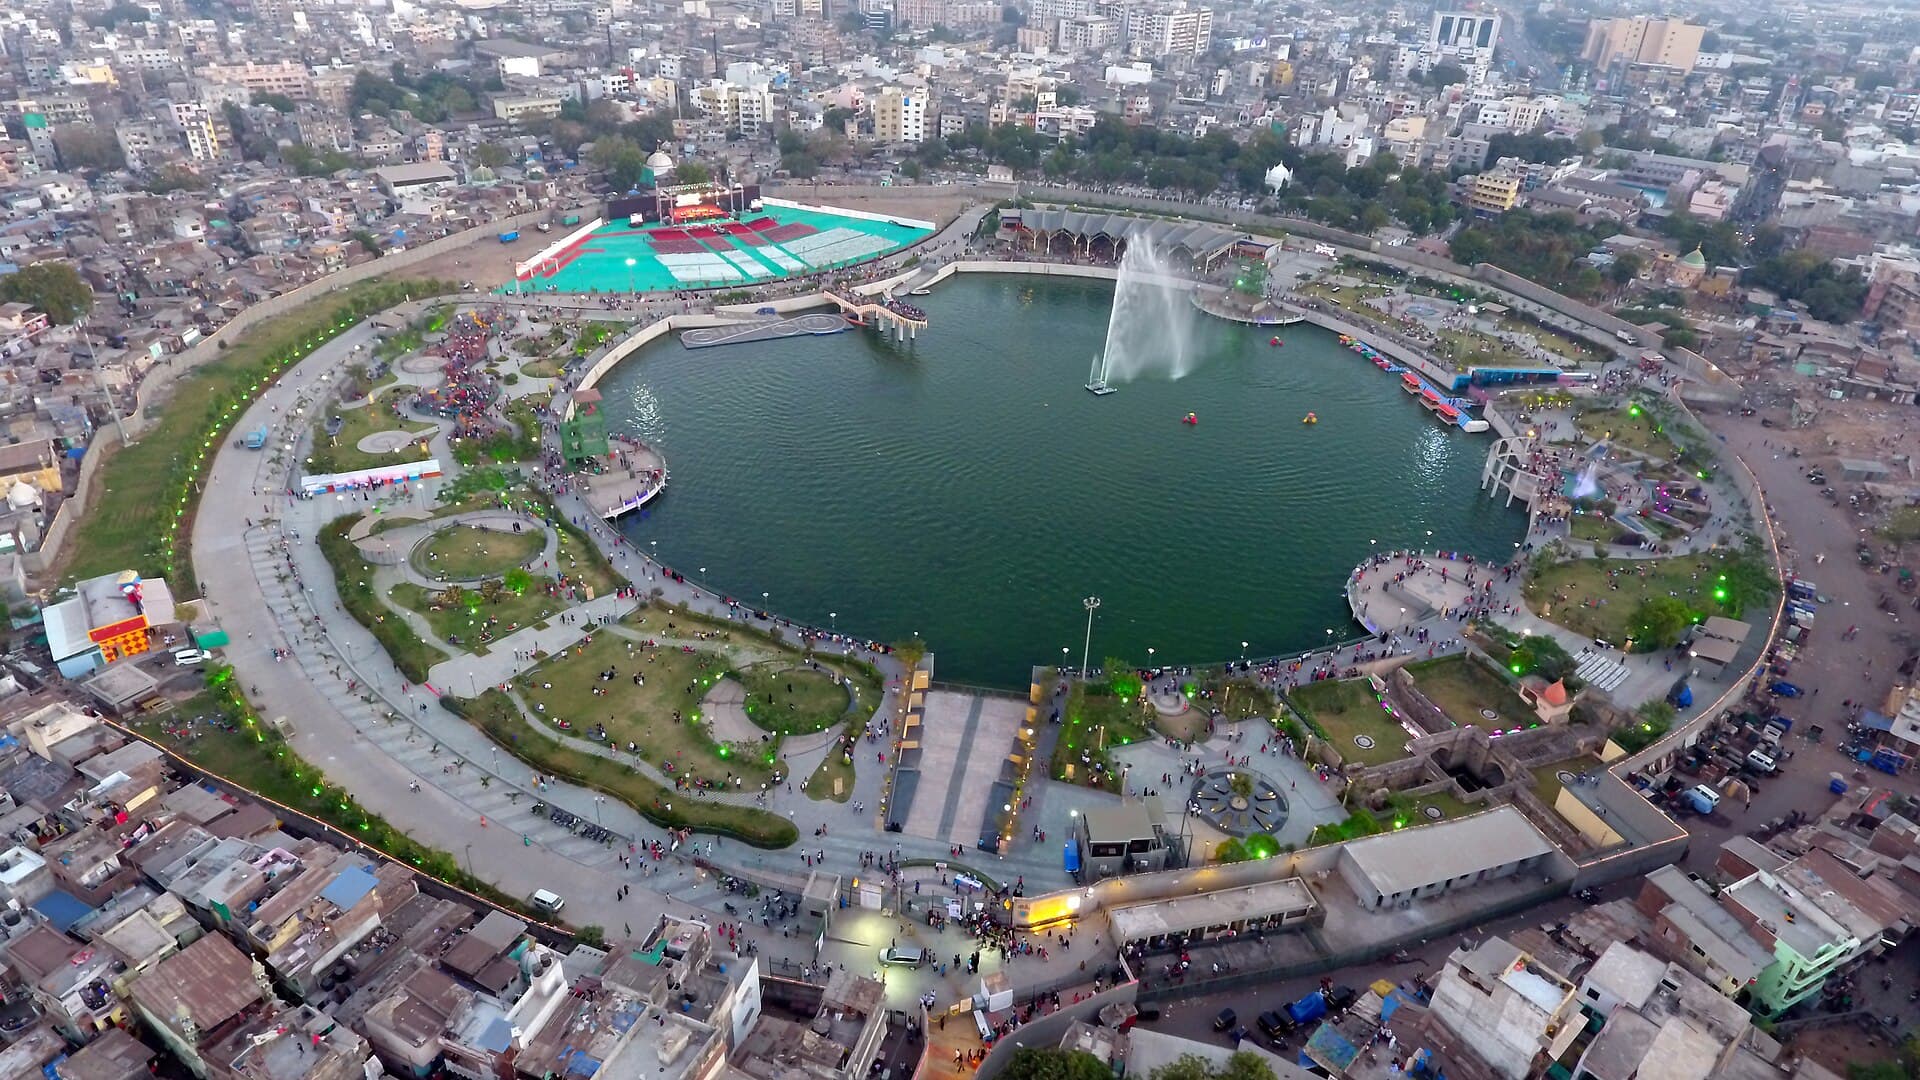
Gopi Talav is still there, restored and landscaped, a rectangle of water in a city of six-lane roads. It is a useful place to stand, because it is roughly where Surat was in 1516, and you can see how far the city has travelled from it.
The corporation's own wardwise table records the distance travelled with unusual precision. In 1961 Surat was 8 square kilometres across 12 wards. Today it is 462.149 square kilometres across 134, reached in six separate annexations, the most recent in June 2020. That is a fifty-fold expansion in sixty years, onto an estuarine flood plain, and it is the precondition for every flood story the city has had since.
The figure survives an independent check, which is why we use it. The nine administrative zones SMC publishes through its own GIS sum to 461.64 square kilometres, and their 2011 census populations sum to 4,645,384. Two separate corporation surfaces, agreeing to within a tenth of a per cent.
What the drainage did in 1994
Surat's worst public health disaster was a water-management failure, and its recovery was a water-management reform.
In September 1994 Surat had a plague outbreak. It started with flooding: water stood for days because the drainage could not take it away, sewers backed up into the standing water, and the city that had grown fifty-fold had drainage, piped water and garbage collection across roughly a third of itself. Tens of thousands of people left the city within days.
What happened next is the part worth remembering. The municipal commissioner who arrived in 1995, S. R. Rao, treated it as an administrative problem rather than a medical one: decentralised decision-making into the zones, required officials to spend their mornings in the field rather than at desks, covered the drains, and enforced the sanitation rules that already existed. Within two years Surat was being described as one of the cleanest cities in India, and it has spent the three decades since near the top of that ranking.
We state this qualitatively and without numbers, because the numbers for it live in news archives and retrospectives rather than in a primary record. The shape of the thing is not in doubt; the precise figures are not ours to assert.
“The disaster was drainage. So was the recovery.”
August 2006, and the numbers we are not printing
Surat's defining flood is the one event about which we will not give you a figure.
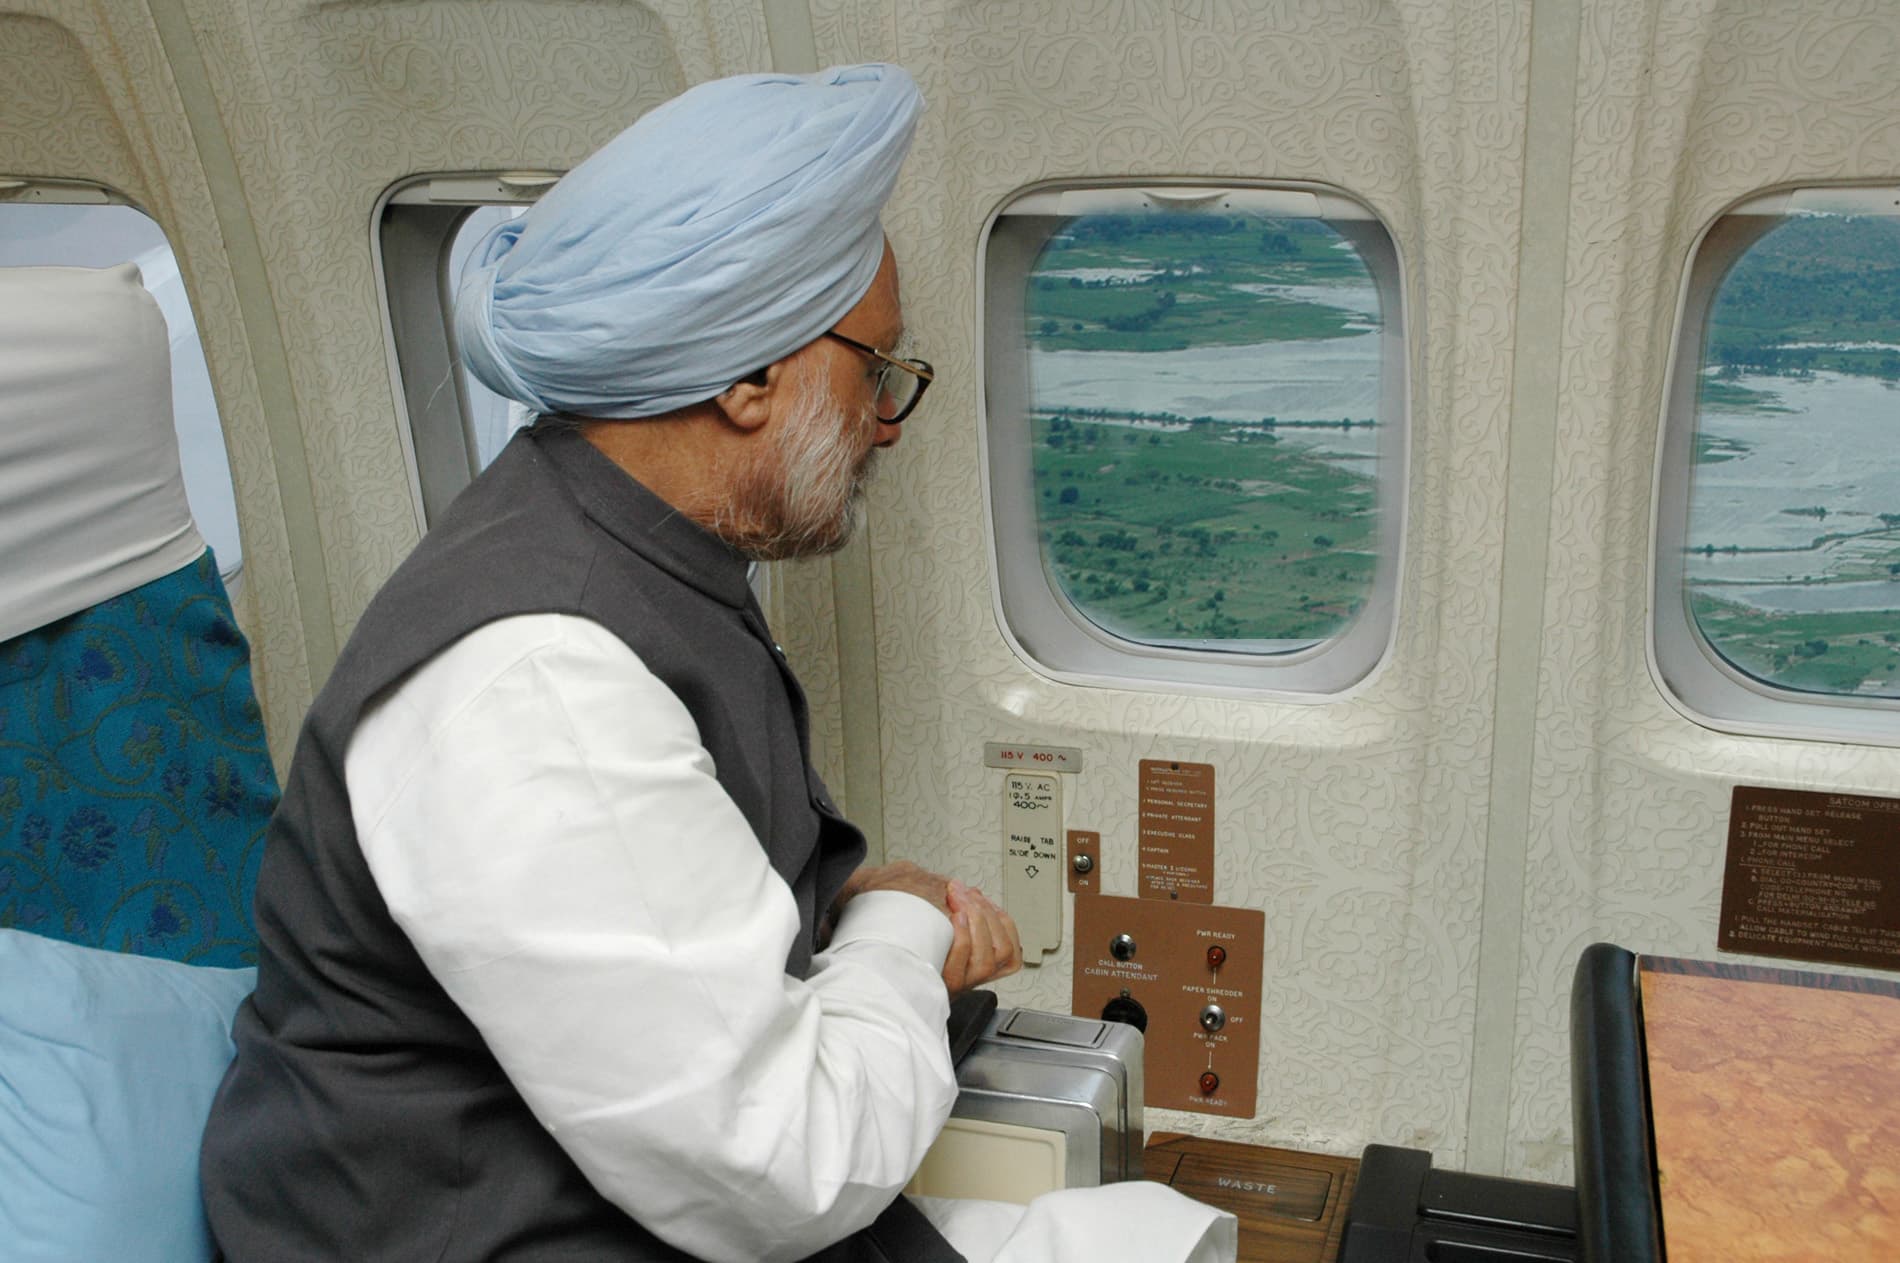
In August 2006 the Tapi came through Surat. Ukai dam, about a hundred kilometres upstream and operated by the state irrigation department rather than by the city, released water at a rate the channel through Surat could not carry. Most of the city went under. The sanitation system built after the plague is widely credited with how quickly the debris was cleared afterwards.
You will notice there are no figures in that paragraph. Not the peak discharge, not the share of the city inundated, not the death toll, not the losses. This is deliberate, and it is the most important sentence in this story.
Every number in circulation for the 2006 flood traces back to encyclopaedia entries, contemporary news coverage, or the reports of citizens' committees, rather than to a primary official record we have read. The figures are probably close to right. But this site's rule is that an external number is verified against a primary source before it is published, and a flood of this consequence is precisely the wrong place to make an exception, because it is precisely the place where a number will be quoted onward. Two documents would settle it: the report of the People's Committee on Gujarat Floods and the Surat Citizens' Council Trust's report. Until we have read them, this chapter is a shape without a scale.
What we can show is the footprint. The corporation's own GIS carries a depth-classed map of the 2006 inundation, and that map is on the flood page. The extent is the corporation's own record. The discharge is somebody else's number.
What Surat publishes now
After 1994 and 2006, Surat built the one thing no other Indian city on this platform publishes: a live warning chain with the thresholds attached.
Go to the corporation's website today and you will find a plain HTML page, updated through the day, that carries four things at once: the level of Ukai dam with its inflow and outflow, the level of the weir-cum-causeway the city drinks from, rainfall for each zone, and the water level in five khadis - the tidal creeks that run through the middle of Surat.
Any city might publish readings. What makes this page unusual is that every reading arrives with the number it is being measured against. Ukai is full at 345 feet. The causeway overflows at 6.0 metres. Kakara Khadi is dangerous at 8.48 metres, Bhedwad at 7.2, Mithi at 9.35, Bhatena at 8.25, Simada at 4.50. The corporation is not merely telling you the level. It is telling you how much room is left.
That is why this city's dashboard looks different from every other city's on this site. There is no days-of-water headline, because there is no stored water to divide - the weir pond is a stretch of river, and Ukai belongs to the state. Instead the dashboard shows the chain in the order the water travels it, and the distance to the threshold at each link. Every one of those thresholds is the corporation's figure, not ours. The only arithmetic we do is subtraction.
There is one catch, and it is the reason this page began being archived the day this city was onboarded: SMC shows about ten readings and keeps no history. There is no archive, no dated URL, no interface. Whatever is not captured on the day is gone.
The city that sells its sewage
Surat turned the waste stream into a revenue line, which is the most transferable thing about it.
Surat is a textile city - several hundred dyeing and printing houses sit in the industrial estates at Pandesara and Sachin - and dyeing needs enormous volumes of water that do not need to be drinkable. In 2014 the corporation opened a tertiary treatment plant at Bamroli that takes treated sewage, puts it through ultrafiltration and reverse osmosis, and sells it to those mills as industrial-grade water.
By the corporation's own accounting in March 2024: eleven sewage treatment plants with a combined 1,726.50 MLD of capacity, about 1,018 MLD of sewage collected and treated, and 330 MLD reused - roughly a third - across eleven named uses. Three tertiary plants produce 115 MLD of that for 249 industrial units. The capital cost was Rs 314.39 crore; cumulative revenue to January 2024 was Rs 496.23 crore. The tariff started at Rs 18.20 a kilolitre in 2014 and now stands at Rs 36.2, indexed annually.
The corporation has committed publicly to 70% reuse by 2030 and 100% with zero liquid discharge by 2035. Those two dates are in the commitments register on this site, with the slide they came from.
A note on sourcing, because it matters here. Press coverage of this programme reports materially different figures - a different cumulative total and a different annual revenue. We use the corporation's own document and cite it, and where the press disagrees with the institution about the institution's own accounts, we take the institution.
What the river is now
The Tapi's problem at Surat is salt, not sewage - which is not what you would guess.
The obvious assumption about an Indian urban river is that the city poisons it: sewage in, dissolved oxygen down, biochemical oxygen demand up. Read CPCB's 2022 monitoring along the Tapi in order from Ukai to the sea and that is not what you find. BOD sits at or below the detection limit at most of the Surat stations. The river is not being organically loaded as it passes through the city, in the way the Musi is at Hyderabad or the Adi Ganga is at Kolkata.
What climbs is conductivity - dissolved salt. It runs 369 to 513 at Ukai, 363 to 7,656 at Kathore just upstream of the city, and 1,537 to 49,720 at the ONGC bridge at Hazira, which is seawater. The city sits twenty kilometres from the Arabian Sea on a river whose flow is controlled upstream, and the sea comes up to meet it.
That is a different problem with a different politics. It is not fixed by intercepting sewage. It is a question about how much freshwater is released from a dam the city does not operate, and when.
What is still missing
The gaps in Surat's public record are specific, and most of them are one administrative decision away from closing.
Surat's municipal GIS is the richest we have found on this platform: roughly 390 layers, including the entire water supply network, the entire sewerage network, ten depth slices of a groundwater resistivity survey, and the depth-classed footprint of the 2006 flood. It is public and it needs no login. But it will only draw you a picture. The setting that would let anyone download the boundaries themselves is switched off, which is why this site has no ward map for Surat and cannot build one. That is a single configuration change on the corporation's side.
Three other absences are worth naming. Surat publishes no measured non-revenue water: the column that looks like one in the national open data release is a flat 20% assumption applied to every month, sitting next to another column that contradicts it. There is no register of which water bodies have been restored, or when, or for how much. And for a textile city, the effluent monitoring that exists - the pollution board's continuous feed, and the discharge monitoring at the Pandesara and Sachin common effluent plants - is not yet on this site.
None of these are secrets. They are, mostly, things that exist inside the corporation and have not been published in a form anyone outside it can use.